


Next: Conclusions from the daily
Up: Measurements
Previous: Conclusions from the mean
In this subsection the current monitor results are compared with
previous results which were obtained when the first weekly data file
was stored. From these weeks the data of the following two days are
compared:
- Thursday 2000/02/10, week 06.
- Wednesday 1999/06/26, week 21.
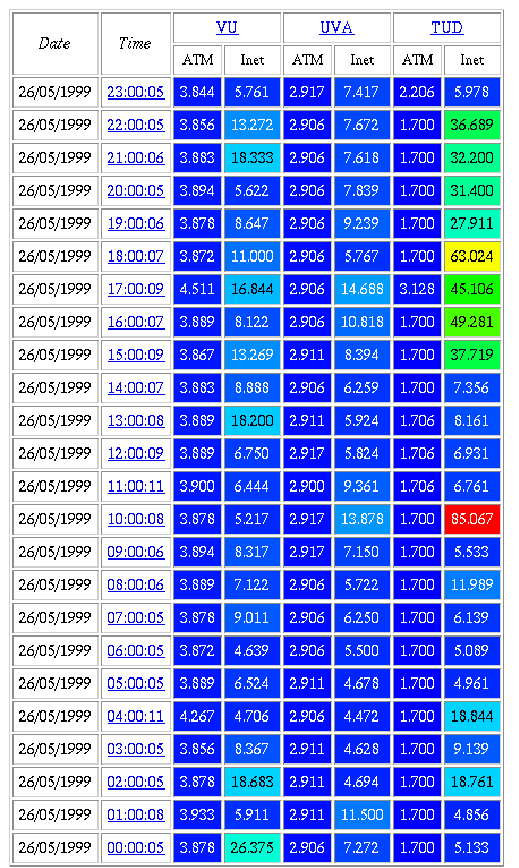
The data are presented by figures with screen dumps of the HTML tables
which are fragments taken from the Web presentation pages. The average
roundtrip results of the RUL cluster are shown as
a typical representation valid for all clusters.
Figure 6 displays the average roundtrip value
from week 06 and figure 7 shows these values
from week 21. Please note that in both tables only the data measured at
the full hours (:00) are shown; the measurements at :30 are skipped for
visibility reasons.
Figure 6:
Average roundtrip values [ms] for the
RUL cluster obtained at
2000/02/10.
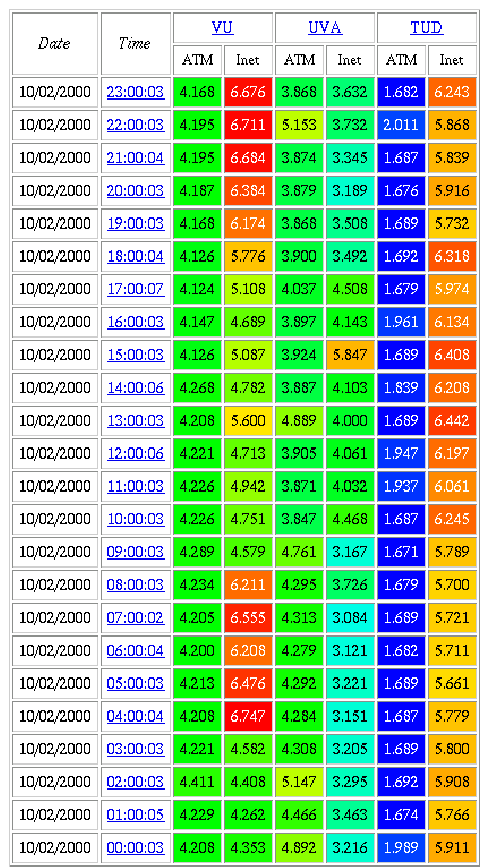 |
Figure 7:
Average roundtrip values [ms] for the
RUL cluster obtained at
1999/06/26.
 |
Hans Blom
2000-03-28