TCP Profile Tests
Description
In this section the results of TCP profile tests will be presented. The TCP
bandwidth will be shaped according to the triangle profile that has been shown
in figure 1 from the
"Rate Limit" main section. The shaped TCP
profile has been generated with a modified version of the
Iperf V. 1.6.5 traffic
generator. Also in this version the pthread library will be used to
generate multiple parallel flows.
Results
In the following figures the resulting TCP bandwidth values, induced by the
provided shaping profile bandwidth, have been displayed as a function of the
profile time. Both the client and server bandwidth results are presented in
these figures with separate plot traces. The results for various values of the
top triangle bandwidth have been shown by individual plots. In these tests a TCP
window size of 2 MBytes have been used. Only results are presented for the
direction where the rate limiting is active, also for:
Amsterdam Science Park -> StarLight.
In the
these results are presented for top triangle bandwidths of
50, 100, ..., 500 Mbits/s with a single TCP flow from source to
destination.
| . |
|
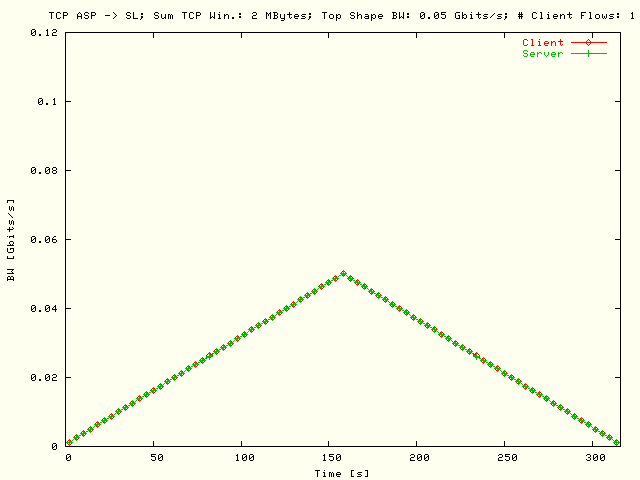
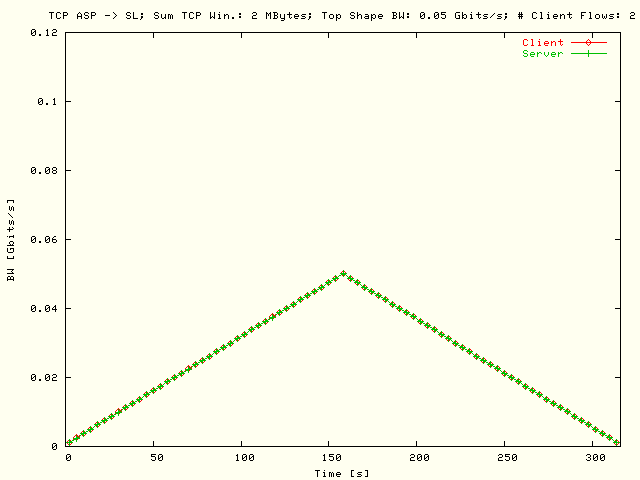
Single flow TCP profile throughput as a function of
the profile time for the test direction with rate limiting Amsterdam
Science Park -> StarLight. The used TCP window size is
2 MBytes/s, and the top triangle bandwidth is 50 Mbits/s. The
client and server throughput values have been presented with separate plot
traces. |
| . |
|
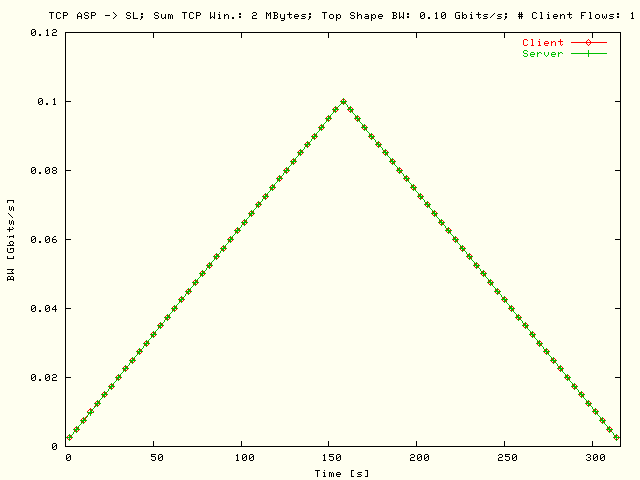
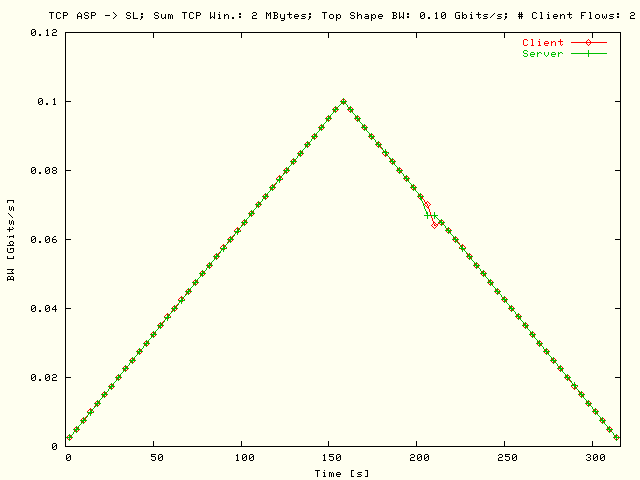
Single flow TCP profile throughput as a function of
the profile time for the test direction with rate limiting Amsterdam
Science Park -> StarLight. The used TCP window size is
2 MBytes/s, and the top triangle bandwidth is 100 Mbits/s. The
client and server throughput values have been presented with separate plot
traces. |
| . |
|
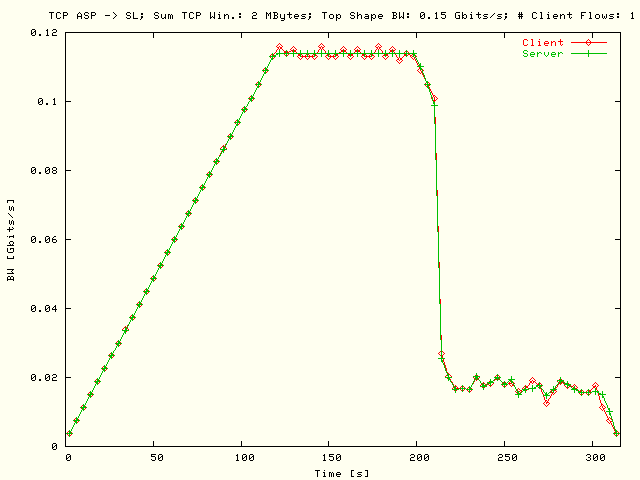
Single flow TCP profile throughput as a function of
the profile time for the test direction with rate limiting Amsterdam
Science Park -> StarLight. The used TCP window size is
2 MBytes/s, and the top triangle bandwidth is 150 Mbits/s. The
client and server throughput values have been presented with separate plot
traces. |
| . |
|
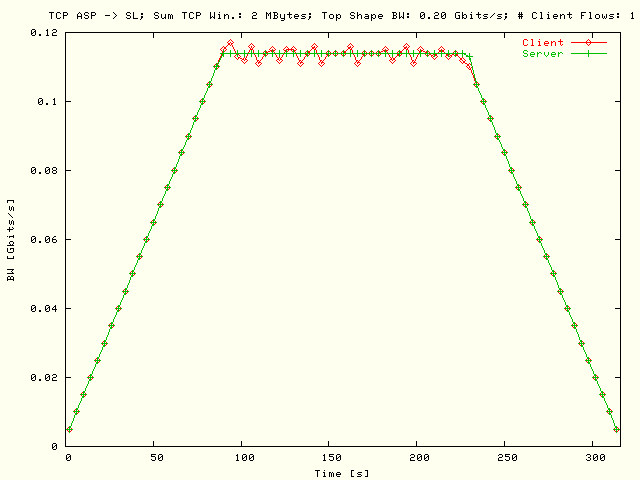
Single flow TCP profile throughput as a function of
the profile time for the test direction with rate limiting Amsterdam
Science Park -> StarLight. The used TCP window size is
2 MBytes/s, and the top triangle bandwidth is 200 Mbits/s. The
client and server throughput values have been presented with separate plot
traces. |
| . |
|
Single flow TCP profile throughput as a function of
the profile time for the test direction with rate limiting Amsterdam
Science Park -> StarLight. The used TCP window size is
2 MBytes/s, and the top triangle bandwidth is 250 Mbits/s. The
client and server throughput values have been presented with separate plot
traces. |
| . |
|
Single flow TCP profile throughput as a function of
the profile time for the test direction with rate limiting Amsterdam
Science Park -> StarLight. The used TCP window size is
2 MBytes/s, and the top triangle bandwidth is 300 Mbits/s. The
client and server throughput values have been presented with separate plot
traces. |
| . |
|
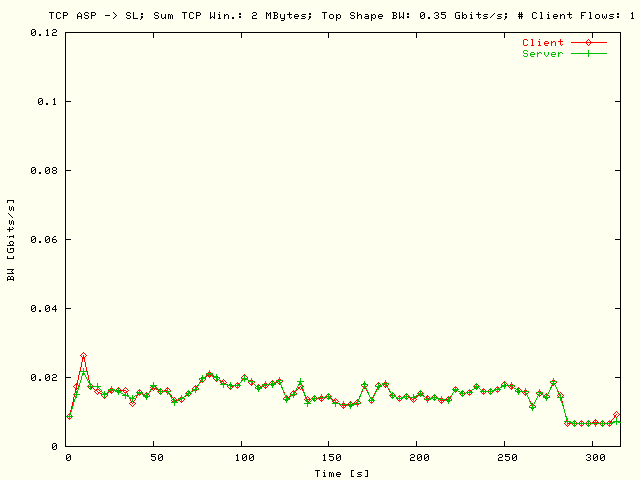
Single flow TCP profile throughput as a function of
the profile time for the test direction with rate limiting Amsterdam
Science Park -> StarLight. The used TCP window size is
2 MBytes/s, and the top triangle bandwidth is 350 Mbits/s. The
client and server throughput values have been presented with separate plot
traces. |
| . |
|
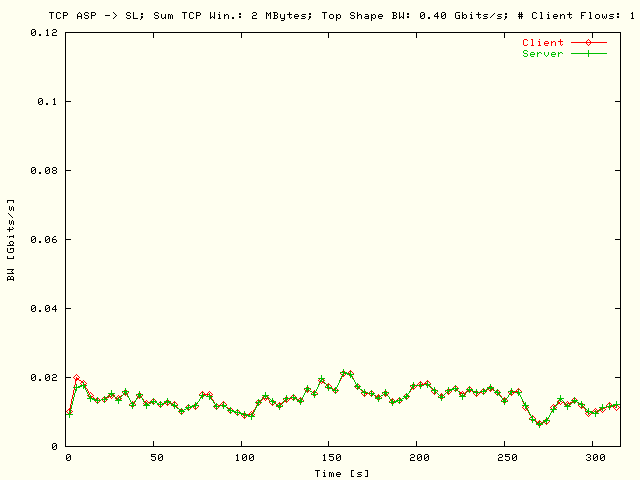
Single flow TCP profile throughput as a function of
the profile time for the test direction with rate limiting Amsterdam
Science Park -> StarLight. The used TCP window size is
2 MBytes/s, and the top triangle bandwidth is 400 Mbits/s. The
client and server throughput values have been presented with separate plot
traces. |
| . |
|
Single flow TCP profile throughput as a function of
the profile time for the test direction with rate limiting Amsterdam
Science Park -> StarLight. The used TCP window size is
2 MBytes/s, and the top triangle bandwidth is 450 Mbits/s. The
client and server throughput values have been presented with separate plot
traces. |
| . |
|
Single flow TCP profile throughput as a function of
the profile time for the test direction with rate limiting Amsterdam
Science Park -> StarLight. The used TCP window size is
2 MBytes/s, and the top triangle bandwidth is 500 Mbits/s. The
client and server throughput values have been presented with separate plot
traces. |
Show also the plots from the
as
in a new browser window.
In the
corresponding results have been displayed as in the previous figures, but here
two parallel flows were used. Both for the top triangle bandwidths and for the
presented throughput values the sums have been taken over the parallel flows.
To be able to take this sum, the throughput interval reports have been
re-sampled according to the original profile intervals.
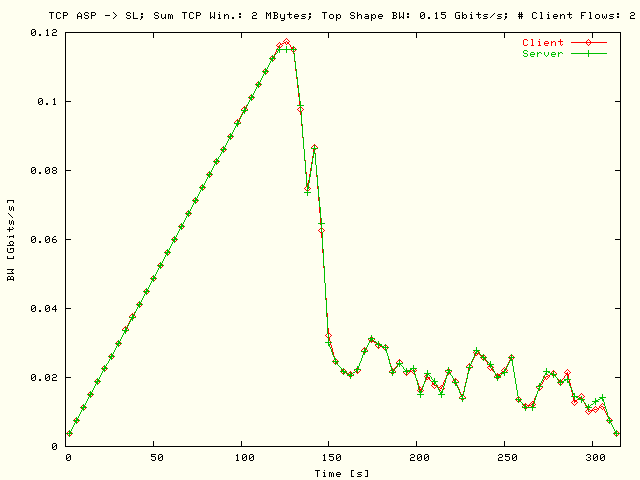
| . |
|
TCP throughput sum, taken over two parallel flows,
as function of the profile time for the test direction with rate limiting
Amsterdam Science Park -> StarLight. The used TCP
window size sum is 2 MBytes/s, and the top triangle bandwidth sum is
50 Mbits/s. Both sums are also taken over the parallel flows. The client
and server throughput values have been presented with separate plot
traces. |
| . |
|
TCP throughput sum, taken over two parallel flows,
as function of the profile time for the test direction with rate limiting
Amsterdam Science Park -> StarLight. The used TCP
window size sum is 2 MBytes/s, and the top triangle bandwidth sum is
100 Mbits/s. Both sums are also taken over the parallel flows. The
client and server throughput values have been presented with separate plot
traces. |
| . |
|
TCP throughput sum, taken over two parallel flows,
as function of the profile time for the test direction with rate limiting
Amsterdam Science Park -> StarLight. The used TCP
window size sum is 2 MBytes/s, and the top triangle bandwidth sum is
150 Mbits/s. Both sums are also taken over the parallel flows. The
client and server throughput values have been presented with separate plot
traces. |
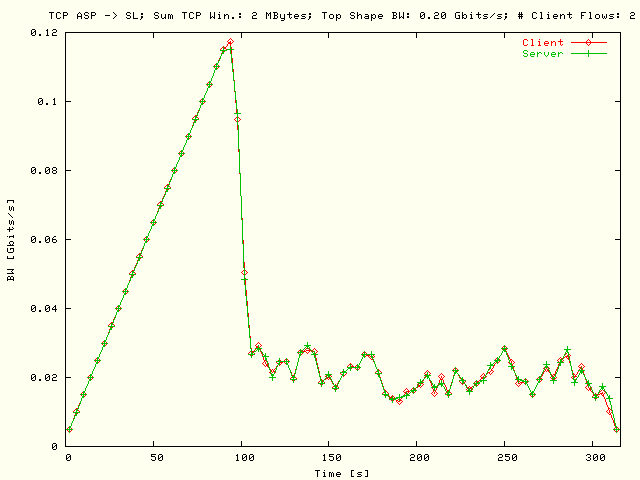
| . |
|
TCP throughput sum, taken over two parallel flows,
as function of the profile time for the test direction with rate limiting
Amsterdam Science Park -> StarLight. The used TCP
window size sum is 2 MBytes/s, and the top triangle bandwidth sum is
200 Mbits/s. Both sums are also taken over the parallel flows. The
client and server throughput values have been presented with separate plot
traces. |
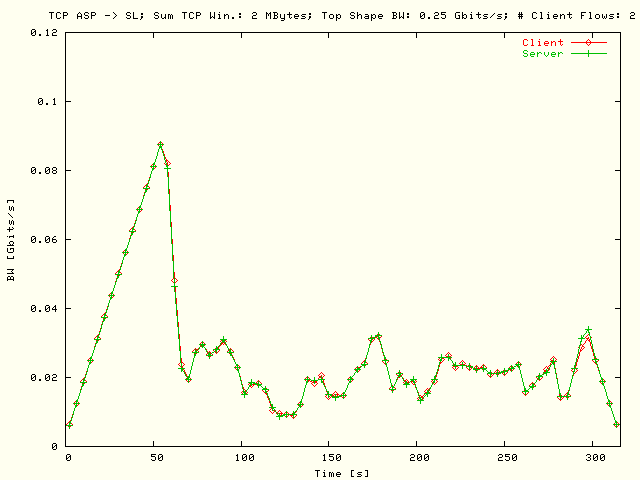
| . |
|
TCP throughput sum, taken over two parallel flows,
as function of the profile time for the test direction with rate limiting
Amsterdam Science Park -> StarLight. The used TCP
window size sum is 2 MBytes/s, and the top triangle bandwidth sum is
250 Mbits/s. Both sums are also taken over the parallel flows. The
client and server throughput values have been presented with separate plot
traces. |
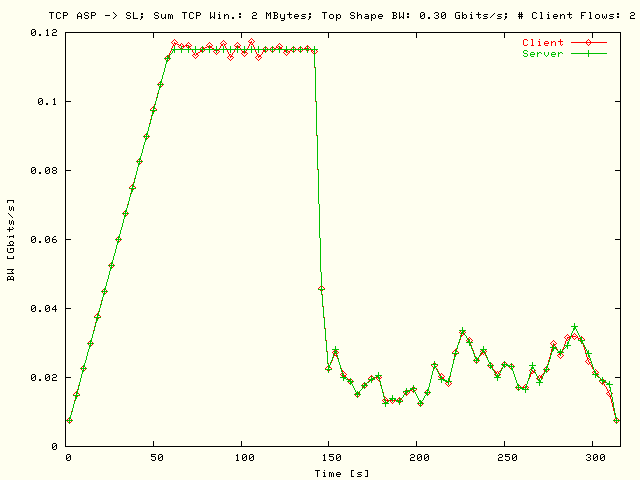
| . |
|
TCP throughput sum, taken over two parallel flows,
as function of the profile time for the test direction with rate limiting
Amsterdam Science Park -> StarLight. The used TCP
window size sum is 2 MBytes/s, and the top triangle bandwidth sum is
300 Mbits/s. Both sums are also taken over the parallel flows. The
client and server throughput values have been presented with separate plot
traces. |
| . |
|
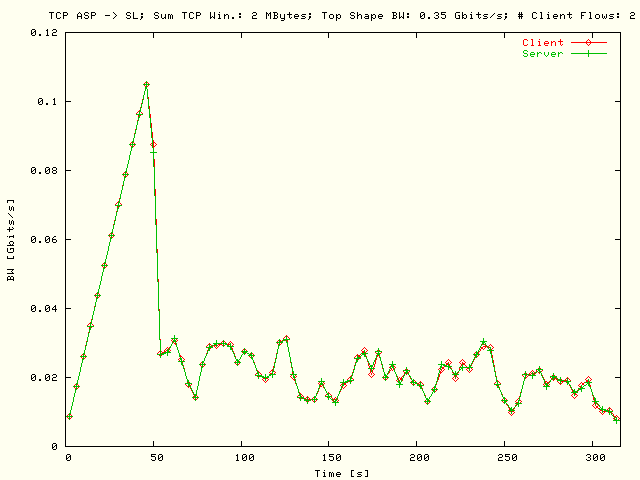
TCP throughput sum, taken over two parallel flows,
as function of the profile time for the test direction with rate limiting
Amsterdam Science Park -> StarLight. The used TCP
window size sum is 2 MBytes/s, and the top triangle bandwidth sum is
350 Mbits/s. Both sums are also taken over the parallel flows. The
client and server throughput values have been presented with separate plot
traces. |
| . |
|
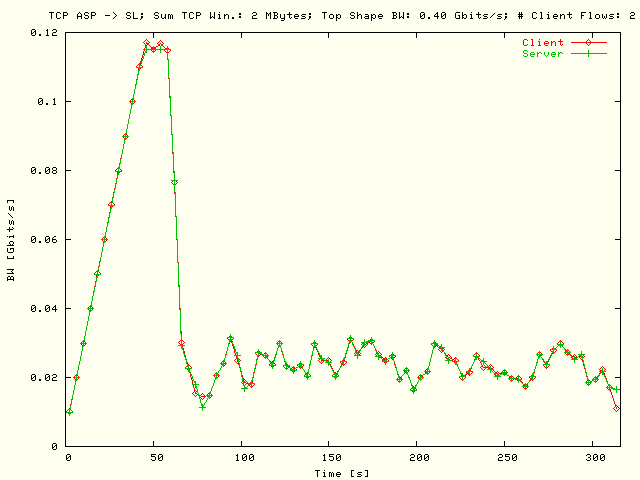
TCP throughput sum, taken over two parallel flows,
as function of the profile time for the test direction with rate limiting
Amsterdam Science Park -> StarLight. The used TCP
window size sum is 2 MBytes/s, and the top triangle bandwidth sum is
400 Mbits/s. Both sums are also taken over the parallel flows. The
client and server throughput values have been presented with separate plot
traces. |
| . |
|
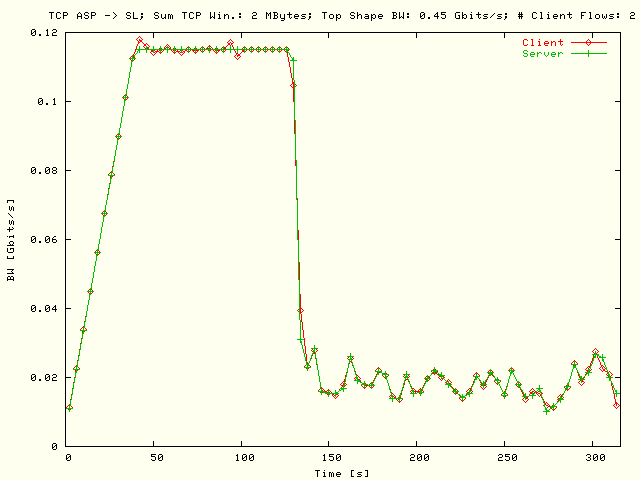
TCP throughput sum, taken over two parallel flows,
as function of the profile time for the test direction with rate limiting
Amsterdam Science Park -> StarLight. The used TCP
window size sum is 2 MBytes/s, and the top triangle bandwidth sum is
450 Mbits/s. Both sums are also taken over the parallel flows. The
client and server throughput values have been presented with separate plot
traces. |
| . |
|
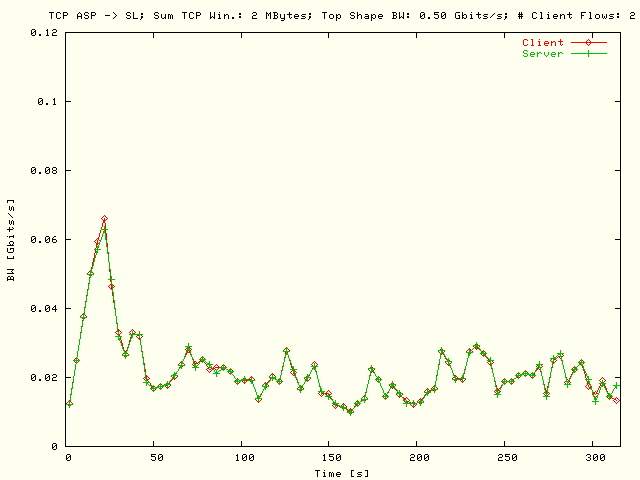
TCP throughput sum, taken over two parallel flows,
as function of the profile time for the test direction with rate limiting
Amsterdam Science Park -> StarLight. The used TCP
window size sum is 2 MBytes/s, and the top triangle bandwidth sum is
500 Mbits/s. Both sums are also taken over the parallel flows. The
client and server throughput values have been presented with separate plot
traces. |
Show also the plots from the
as
in a new browser window.
Conclusions
From the TCP profile tests presented in the
the following conclusions can be drawn:
-
In the single flow results
()
the following patterns can be seen:
-
For the top triangle bandwidth values of 50 and 100 Mbits/s,
(
)
the expected theoretical profile is also be found. The reason for that
could be:
-
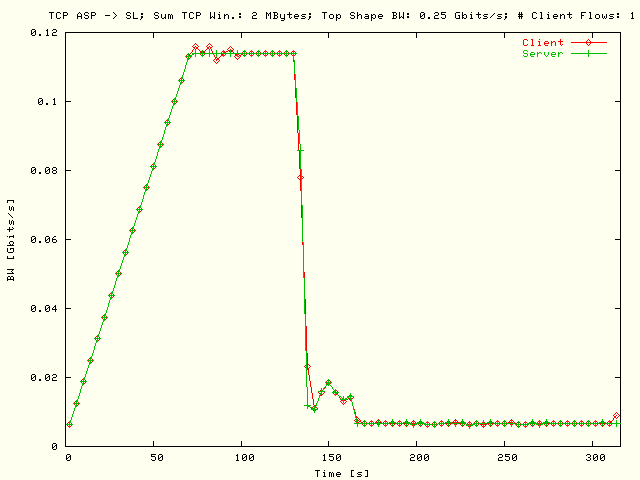
For the top triangle bandwidth values of 150, 200 and
250 Mbits/s
(,
)
a saturation level of about 0.11 Gbits/s could be found. This is in
well agreement with the bandwidth limit induced my the TCP window size
mentioned above.
-
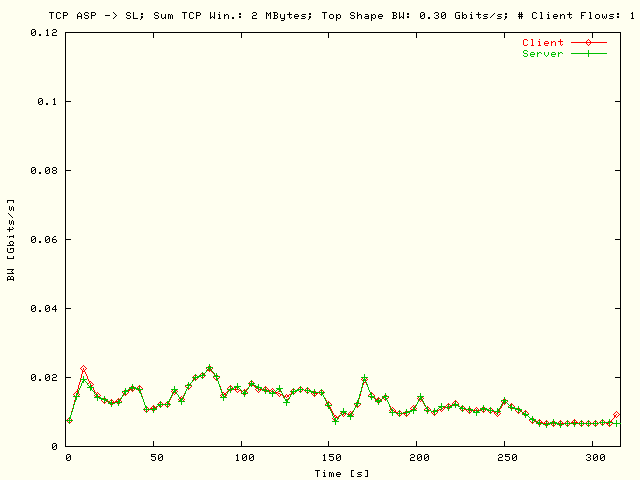
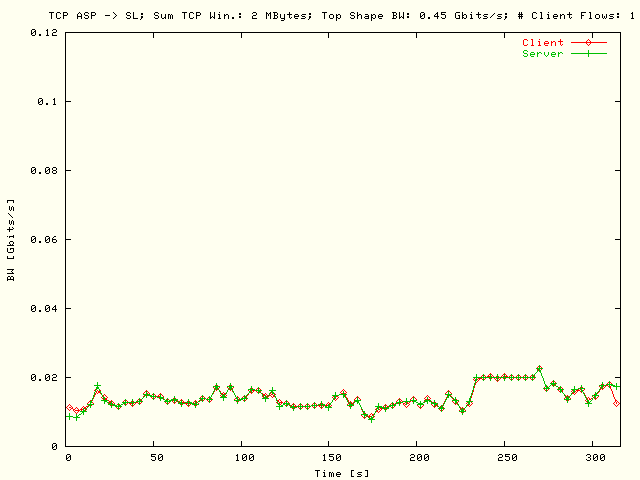
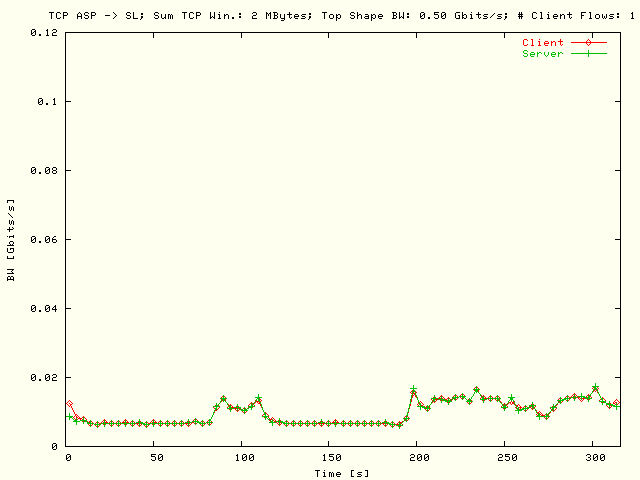
For the results with a top triangle bandwidth ≥ 300 Mbits/s
()
the maximum achieved throughput falls back below 0.02 Gbits/s. This
presumably has been caused by the rate limit settings. This value is in
good agreement with the results for a single flow in the TCP bulk
results. See
figure 1 in the
"TCP Bulk Tests" section.
-
For the results with two parallel flows
()
about the same conclusions can be drawn as for the results obtained with a
single flow. The most important difference here is that the fall back caused
by the rate limiting effects is starting at larger values of the profile
times. Because the top triangle bandwidths per flow are here the half from
the corresponding single flow values, there could be less packets lost
caused by busts that are related with the shaped bandwidth height.
-
In general the values for the client and server bandwidths are identical as
could be detected. When there are differences they probably are related with
differences in the domain size of the sample interval, eventually combined
with our re-sampling to the original sample intervals. Please note that the
domain sizes of the
Iperf sampling intervals
are in general becoming irregular at the areas with packets lost.