Bandwidth Interval Plots
In the following sub-sections results are displayed in the form of
UDT and TCP bandwidth plots as a
function of the absolute interval time of the network test which
implies that also the delay times are included at the interval times.
Shaped Bandwidth Variation
In the
plots of the bandwidth interval reports from the
UDT and TCP flows are presented as a
function of the absolute interval time of the network test, also with delay
times included. In the left plots the
UDT flows are delayed and in the right
plots the TCP flows. In the TCP plot trace the markers are denoting the overall
sum of the TCP flows. The standard deviation in the TCP sum is denoted by the
error-bars, representing the variation in the TCP bandwidths. These tests were
executed with one parallel flow per node pair. There were 11 node pairs
used in each VLAN. Each node had been connected with all nodes in the other
VLAN, so 11 × 11 different TCP flows were used. Each figure
shows the value of a different shaped TCP bandwidth varying from 2 Mbits/s
()
to 10 Mbits/s
().
| . |
|
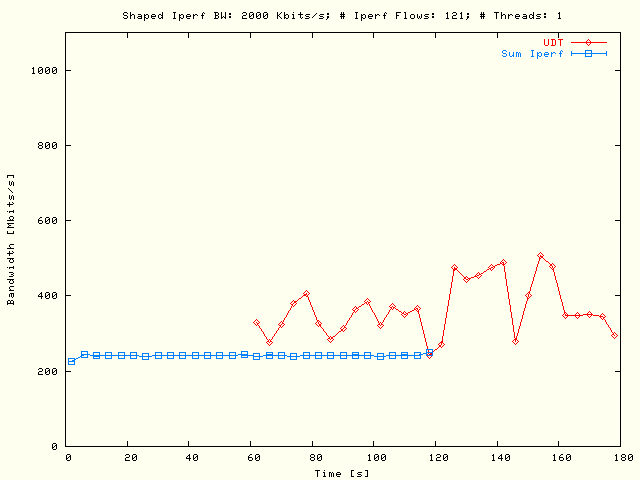
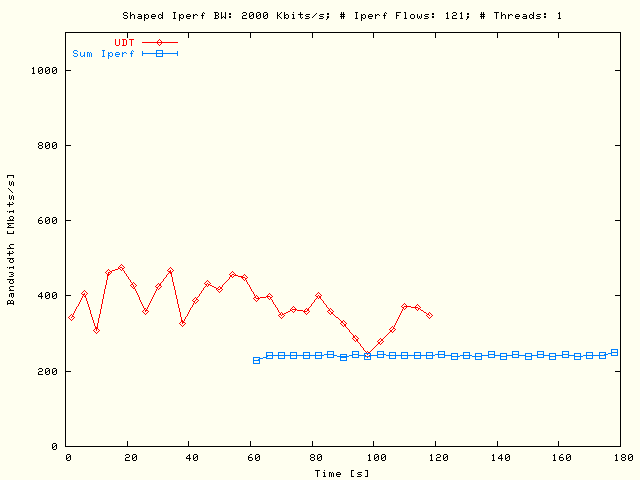
Single flow
UDT and multiple flows TCP
bandwidth as a function of the absolute test time. In the left plot the
UDT flow has been delayed and
in the right plot the TCP flows. The TCP flows were defined by all
possible 11 × 11 node pairs, using one parallel flow per
node pair. The shaped TCP bandwidth was 2 Mbits/s. |
| . |
|
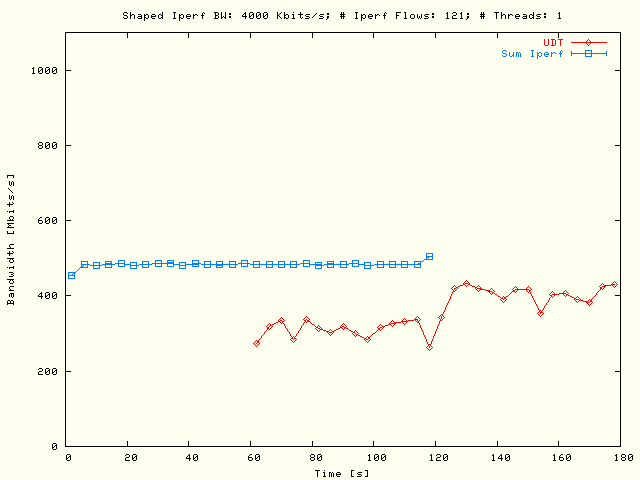
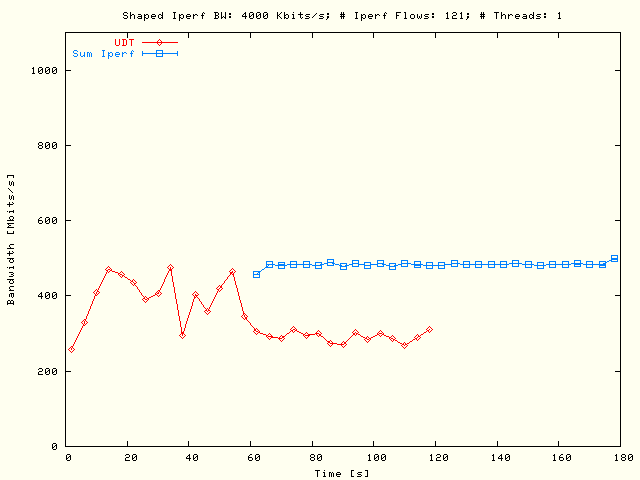
Single flow
UDT and multiple flow TCP
bandwidth as a function of the absolute test time. In the left plot the
UDT flow has been delayed and
in the right plot the TCP flows. The TCP flows were defined by all
possible 11 × 11 node pairs, using one parallel flow per
node pair. The shaped TCP bandwidth was 4 Mbits/s. |
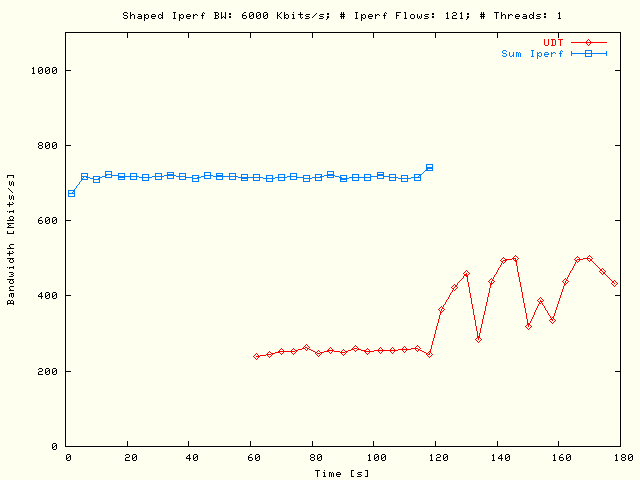
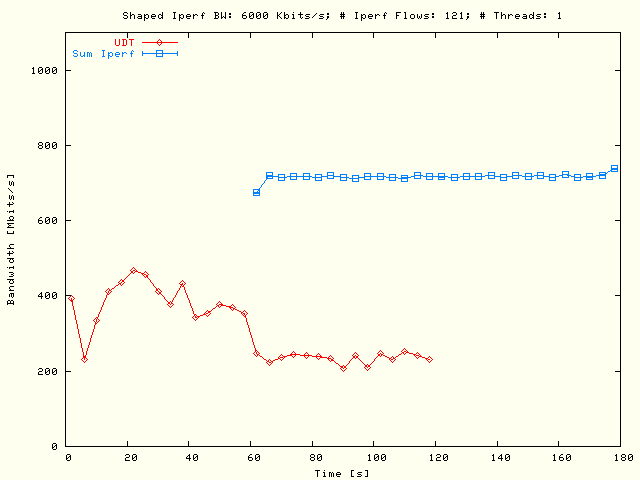
| . |
|
Single flow
UDT and multiple flow TCP
bandwidth as a function of the absolute test time. In the left plot the
UDT flow has been delayed and
in the right plot the TCP flows. The TCP flows were defined by all
possible 11 × 11 node pairs, using one parallel flow per
node pair. The shaped TCP bandwidth was 6 Mbits/s. |
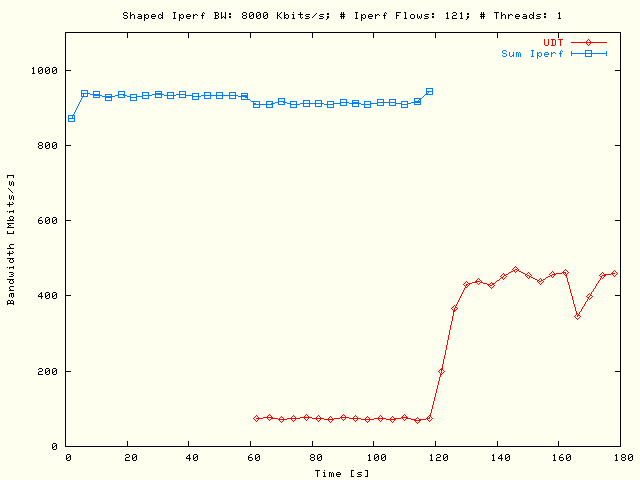
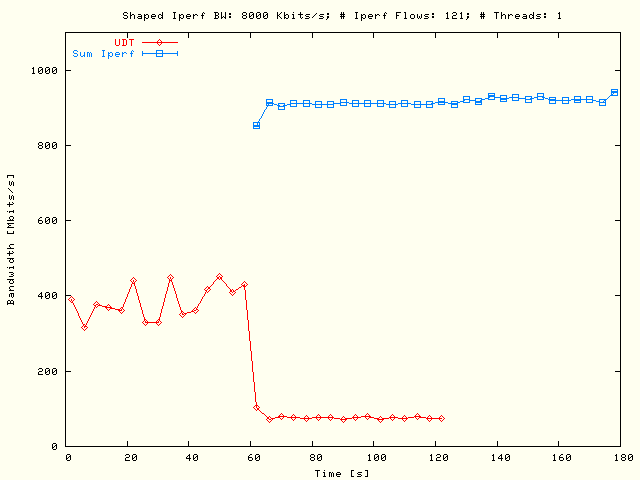
| . |
|
Single flow
UDT and multiple flow TCP
bandwidth as a function of the absolute test time. In the left plot the
UDT flow has been delayed and
in the right plot the TCP flows. The TCP flows were defined by all
possible 11 × 11 node pairs, using one parallel flow per
node pair. The shaped TCP bandwidth was 8 Mbits/s. |
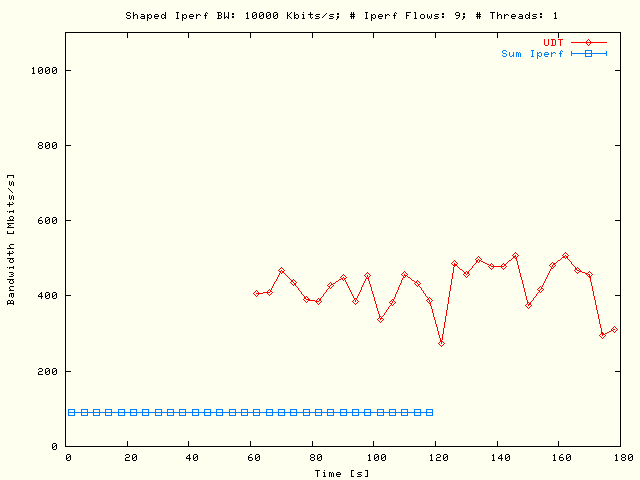
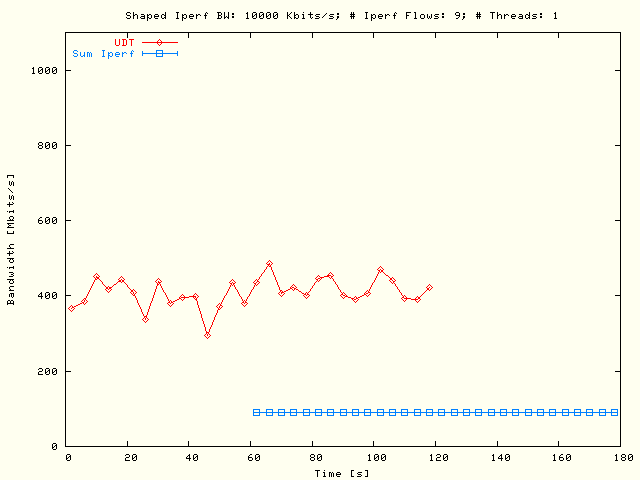
| . |
|
Single flow
UDT and multiple flow TCP
bandwidth as a function of the absolute test time. In the left plot the
UDT flow has been delayed and
in the right plot the TCP flows. The TCP tests were defined by all
possible 11 × 11 node pairs, using one parallel flow per
node pair. The shaped TCP bandwidth was
10 Mbits/s. |
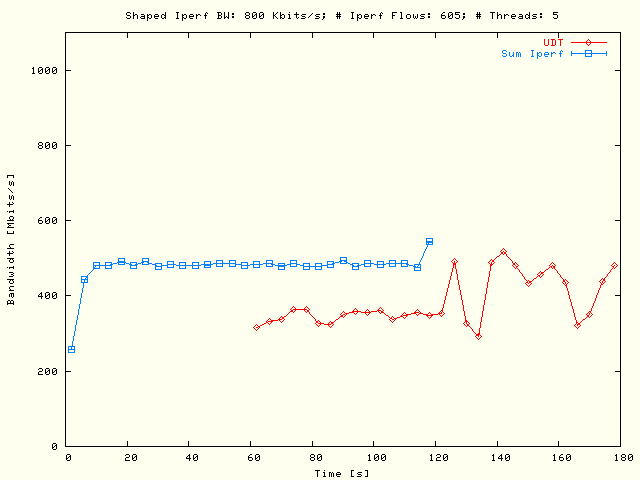
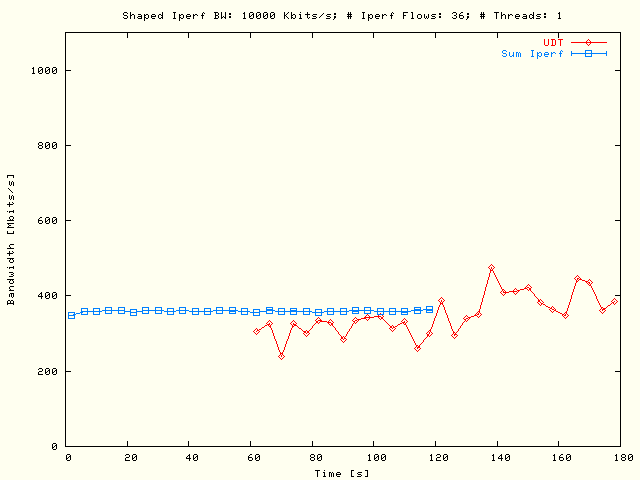
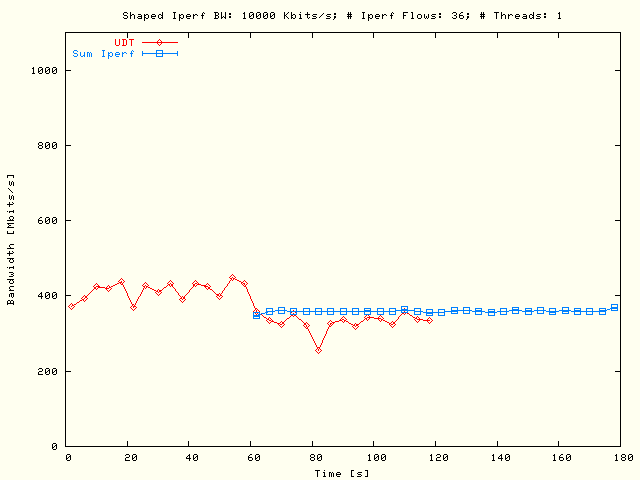
In the
equivalent results are displayed as in the
with the exception that there are now five threaded parallel TCP flows per node
pair used while in the previous situation only a single TCP flow per node pair
had been used with the constraint that the sum over all parallel flows per node
pair had been kept the same in both situations.
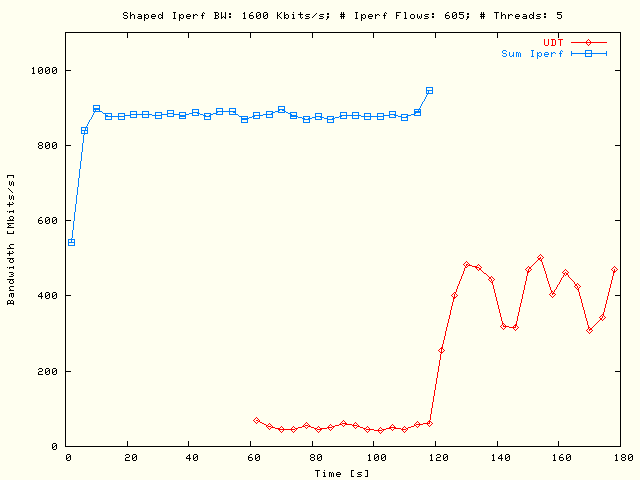
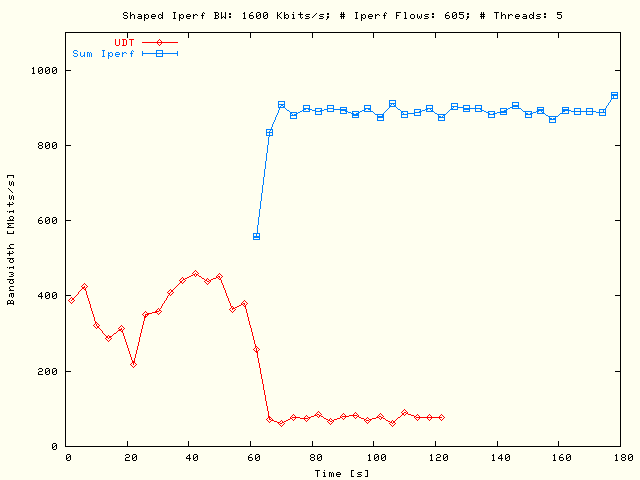
| . |
|
Single flow
UDT and multiple flow TCP
bandwidth as a function of the absolute test time. In the left plot the
UDT flow has been delayed and
in the right plot the TCP flows. The TCP flows were defined by all
possible 11 × 11 node pairs, using five parallel flows
per node pair. The sum of the shaped TCP bandwidth over the parallel
flows per node pair was 2 Mbits/s. |
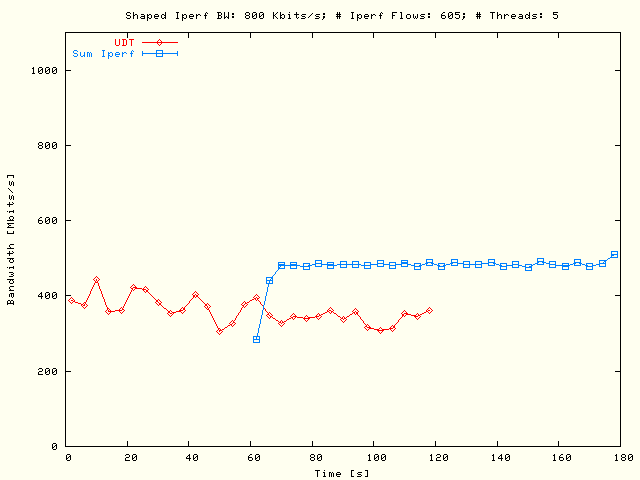
| . |
|
Single flow
UDT and multiple flow TCP
bandwidth as a function of the absolute test time. In the left plot the
UDT flow has been delayed and
in the right plot the TCP flows. The TCP flows were defined by all
possible 11 × 11 node pairs, using five parallel flows
per node pair. The sum of the shaped TCP bandwidth over the parallel
flows per node pair was 4 Mbits/s. |
| . |
|
Single flow
UDT and multiple flow TCP
bandwidth as a function of the absolute test time. In the left plot the
UDT flow has been delayed and
in the right plot the TCP flows. The TCP flows were defined by all
possible 11 × 11 node pairs, using five parallel flows
per node pair. The sum of the shaped TCP bandwidth over the parallel
flows per node pair was 6 Mbits/s. |
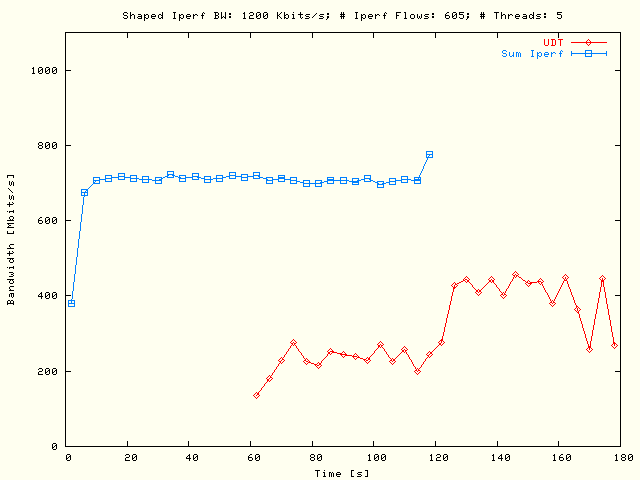
| . |
|
Single flow
UDT and multiple flow TCP
bandwidth as a function of the absolute test time. In the left plot the
UDT flow has been delayed and
in the right plot the TCP flows. The TCP flows were defined by all
possible 11 × 11 node pairs, using five parallel flows
per node pair. The sum of the shaped TCP bandwidth over the parallel
flows per node pair was 8 Mbits/s. |
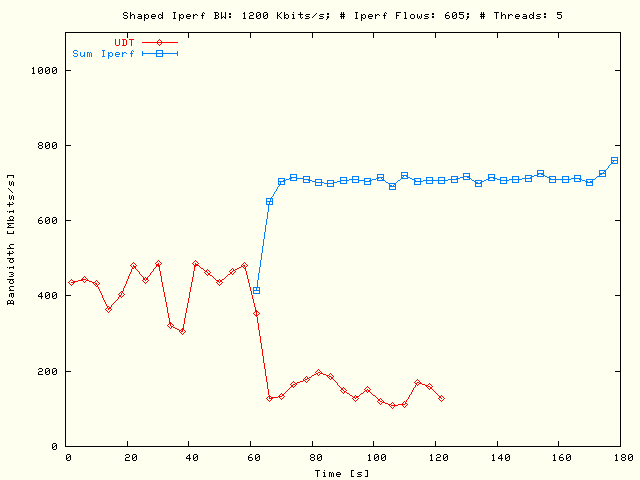
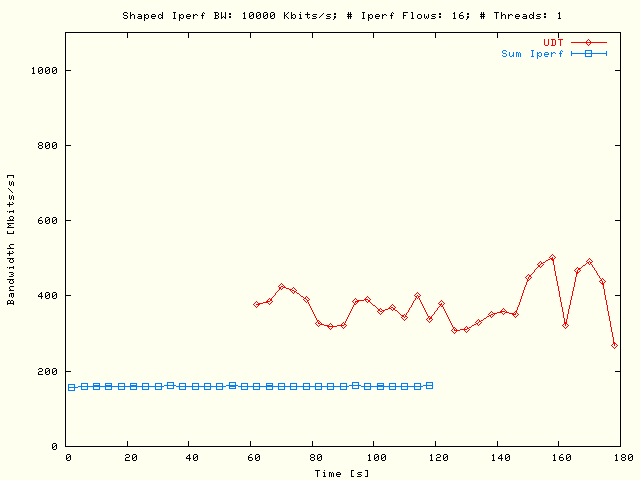
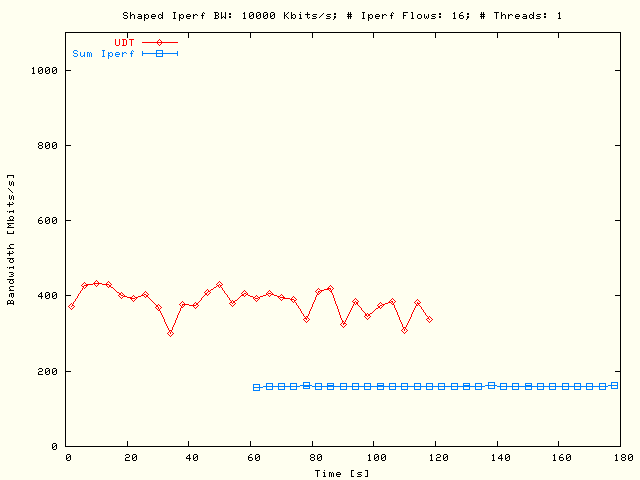
| . |
|
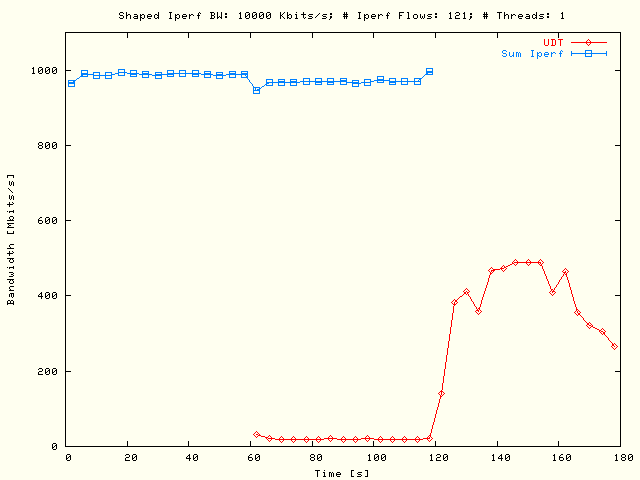
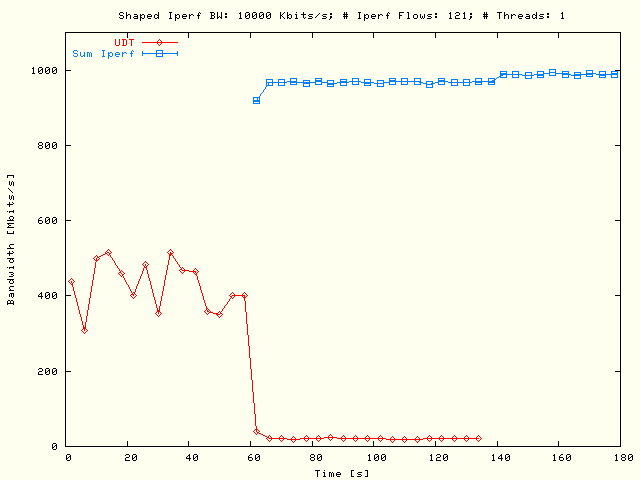
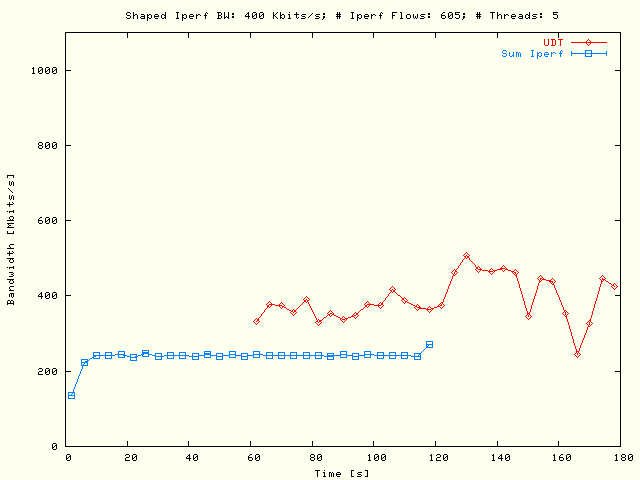
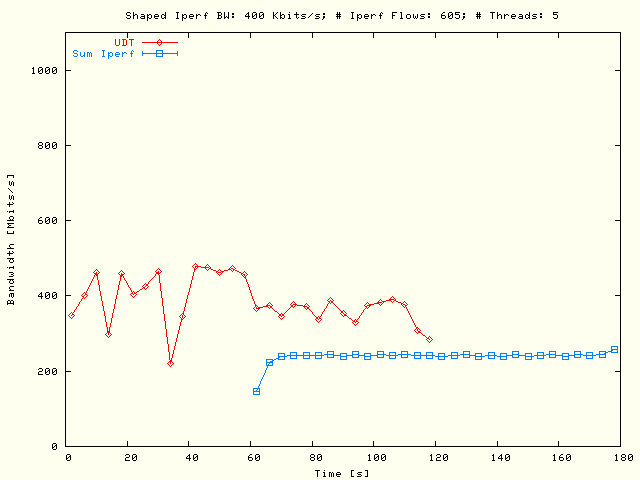
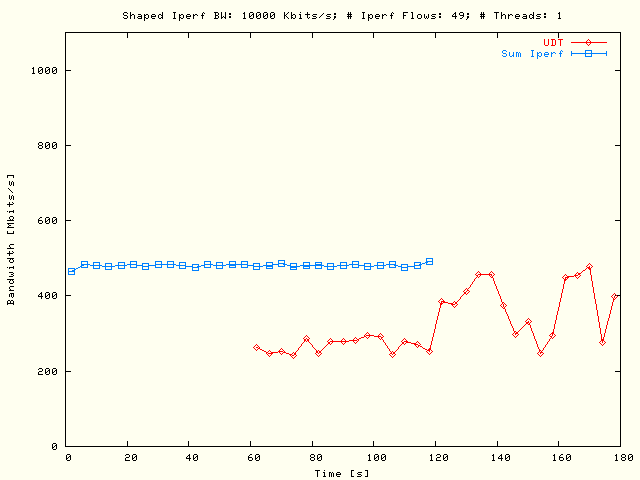
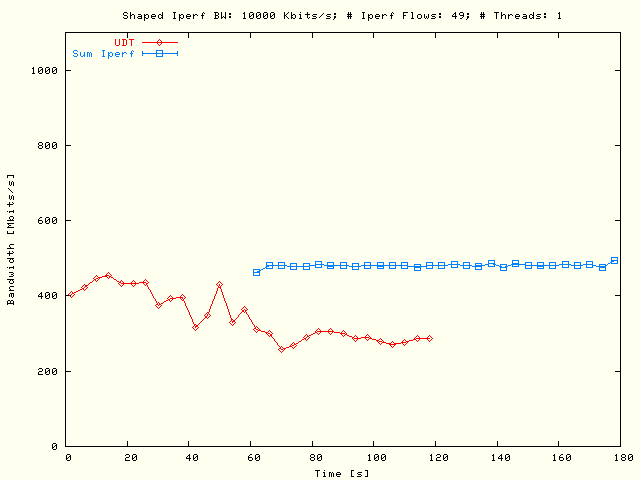
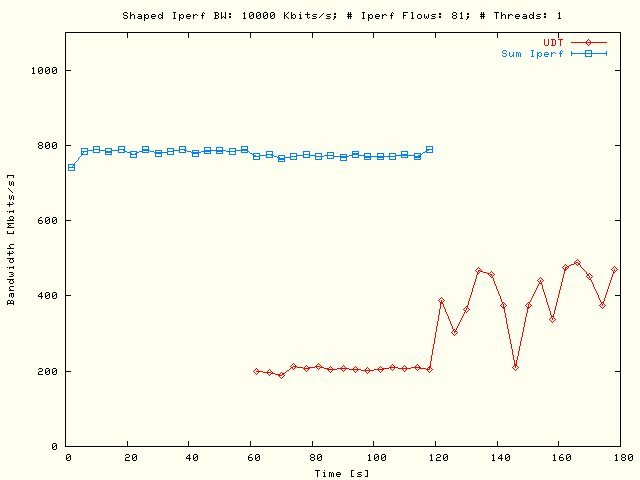
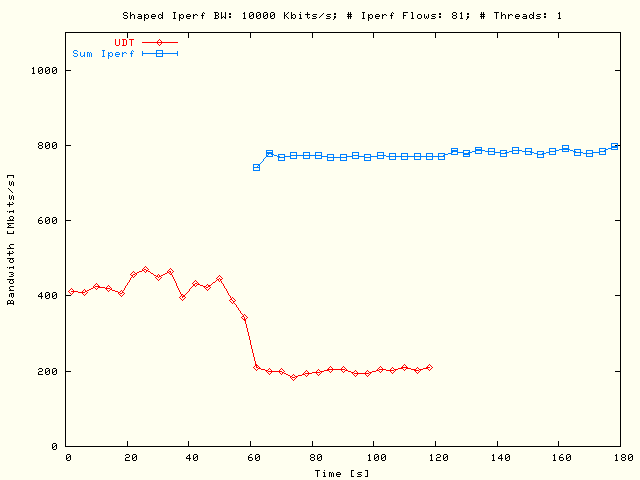
Single flow
UDT and multiple flow TCP
bandwidth as a function of the absolute test time. In the left plot the
UDT flow has been delayed and
in the right plot the TCP flows. The TCP flows were defined by all
possible 11 × 11 node pairs, using five parallel flows
per node pair. The sum of the shaped TCP bandwidth over the parallel
flows per node pair was 10 Mbits/s. |
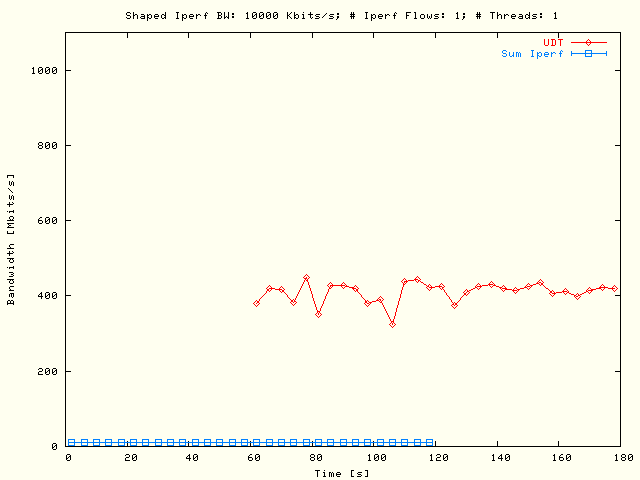
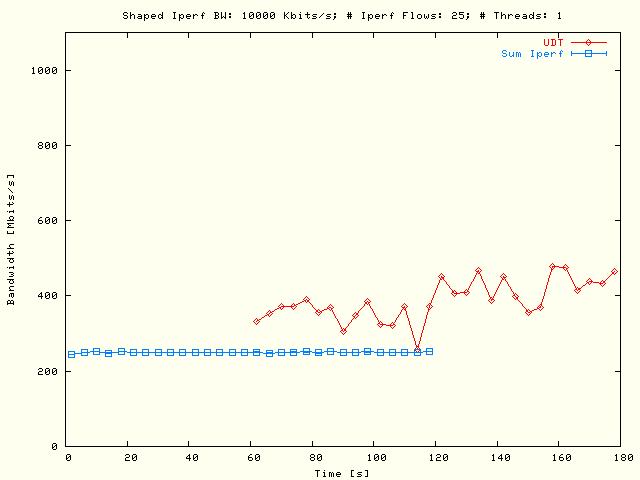
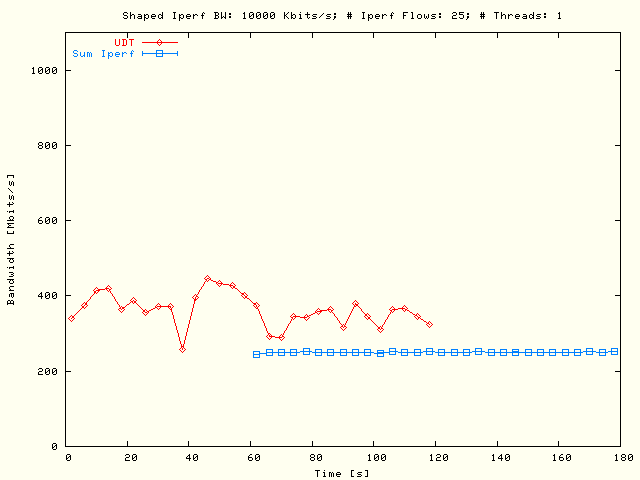
Comparing the single flow per node pair results
()
with the tests were five threaded parallel flows per node pair were used
()
shows that there are not much differences between both test types. In the
regions with combined UDT and TCP
traffic, there is a small decrease in the sum of the TCP bandwidth for shaped
bandwidths ≥ 8 Mbits/s, but when five parallel flows are used hardly
any influence from the UDT flow could
be noticed. Besides this difference the results of both tests are well
comparable. The observed bandwidths are in good agreement what could be expected
from the shaped bandwidth values.
Please note that the unrealistic high bandwidth values from the highest interval
report is an artifact from the
Iperf tool. These values
were also found in the raw
Iperf data. Please note also
that the Iperf and
UDT boundaries of the bandwidth
reports do not exactly match with the used interval time. To be able to sum the
TCP bandwidths, the intervals are re-sampled back to the time stamps following
from the used interval time. To be consistent the same re-sampling algorithm has
been used for all results, so also for the single flow results.
# TCP Flows Variation
As before the
are presenting bandwidth interval report plots as a function of the absolute
interval time, but in these plots the # TCP flows, defined by the
# source - destination node pairs, will be varied. These results are
displayed for single parallel flows and with a shaped TCP bandwidth of
10 Mbits/s.
| . |
|
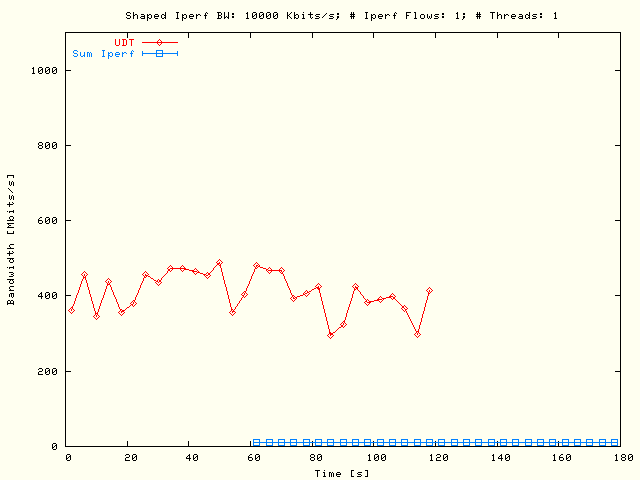
Single flow
UDT and (here also) single
flow TCP bandwidth as a function of the absolute test time. In the left
plot the UDT flow has been
delayed and in the right plot the TCP flow. The TCP flow was defined by
the only possible 1 × 1 node pair, using one parallel
flow. The shaped TCP bandwidth was 10 Mbits/s. |
| . |
|
Single flow
UDT and multiple flows TCP
bandwidth as a function of the absolute test time. In the left plot the
UDT flow has been delayed and
in the right plot the TCP flows. The TCP flows were defined by all
possible 2 × 2 node pairs, using one parallel flow per
node pair. The shaped TCP bandwidth was
10 Mbits/s. |
| . |
|
Single flow
UDT and multiple flows TCP
bandwidth as a function of the absolute test time. In the left plot the
UDT flow has been delayed and
in the right plot the TCP flows. The TCP flows were defined by all
possible 3 × 3 node pairs, using one parallel flow per
node pair. The shaped TCP bandwidth was
10 Mbits/s. |
| . |
|
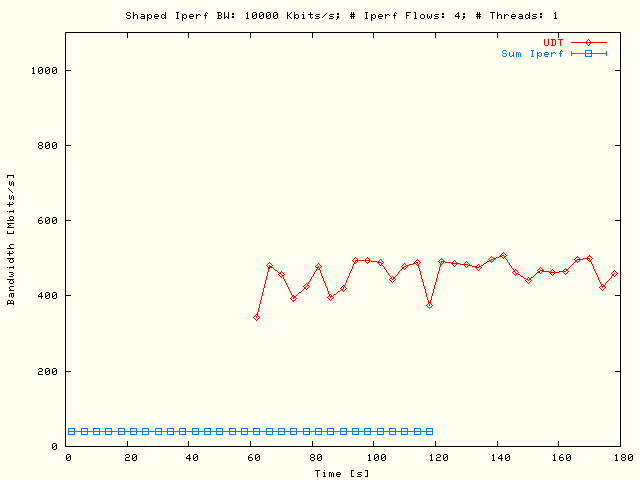
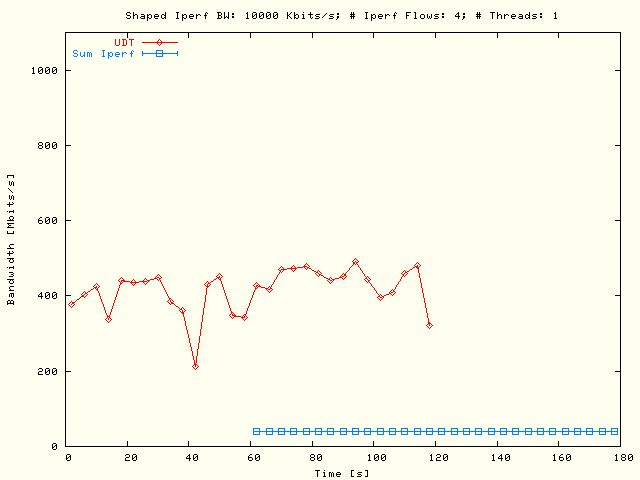
Single flow
UDT and multiple flows TCP
bandwidth as a function of the absolute test time. In the left plot the
UDT flow has been delayed and
in the right plot the TCP flows. The TCP flows were defined by all
possible 4 × 4 node pairs, using one parallel flow per
node pair. The shaped TCP bandwidth was
10 Mbits/s. |
| . |
|
Single flow
UDT and multiple flows TCP
bandwidth as a function of the absolute test time. In the left plot the
UDT flow has been delayed and
in the right plot the TCP flows. The TCP flows were defined by all
possible 5 × 5 node pairs, using one parallel flow per
node pair. The shaped TCP bandwidth was
10 Mbits/s. |
| . |
|
Single flow
UDT and multiple flows TCP
bandwidth as a function of the absolute test time. In the left plot the
UDT flow has been delayed and
in the right plot the TCP flows. The TCP flows were defined by all
possible 6 × 6 node pairs, using one parallel flow per
node pair. The shaped TCP bandwidth was
10 Mbits/s. |
| . |
|
Single flow
UDT and multiple flows TCP
bandwidth as a function of the absolute test time. In the left plot the
UDT flow has been delayed and
in the right plot the TCP flows. The TCP flows were defined by all
possible 7 × 7 node pairs, using one parallel flow per
node pair. The shaped TCP bandwidth was
10 Mbits/s. |
| . |
|
Single flow
UDT and multiple flows TCP
bandwidth as a function of the absolute test time. In the left plot the
UDT flow has been delayed and
in the right plot the TCP flows. The TCP flows were defined by all
possible 8 × 8 node pairs, using one parallel flow per
node pair. The shaped TCP bandwidth was
10 Mbits/s. |
| . |
|
Single flow
UDT and multiple flows TCP
bandwidth as a function of the absolute test time. In the left plot the
UDT flow has been delayed and
in the right plot the TCP flows. The TCP flows were defined by all
possible 9 × 9 node pairs, using one parallel flow per
node pair. The shaped TCP bandwidth was
10 Mbits/s. |
| . |
|
Single flow
UDT and multiple flows TCP
bandwidth as a function of the absolute test time. In the left plot the
UDT flow has been delayed and
in the right plot the TCP flows. The TCP flows were defined by all
possible 10 × 10 node pairs, using one parallel flow per
node pair. The shaped TCP bandwidth was
10 Mbits/s. |
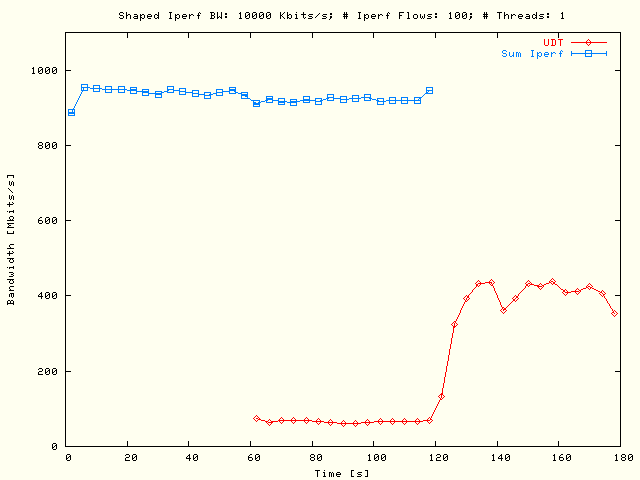
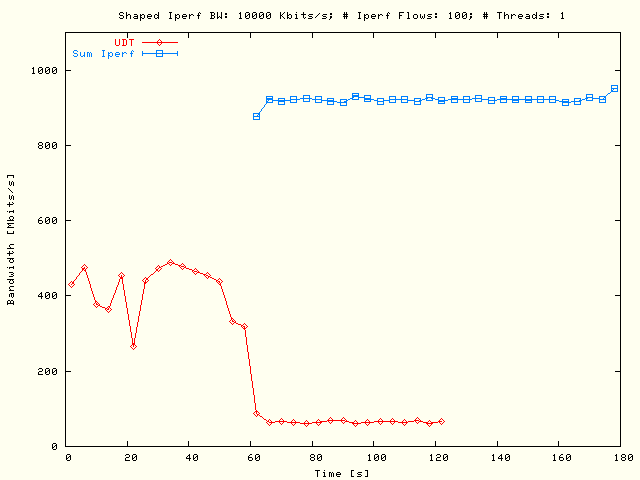
| . |
|
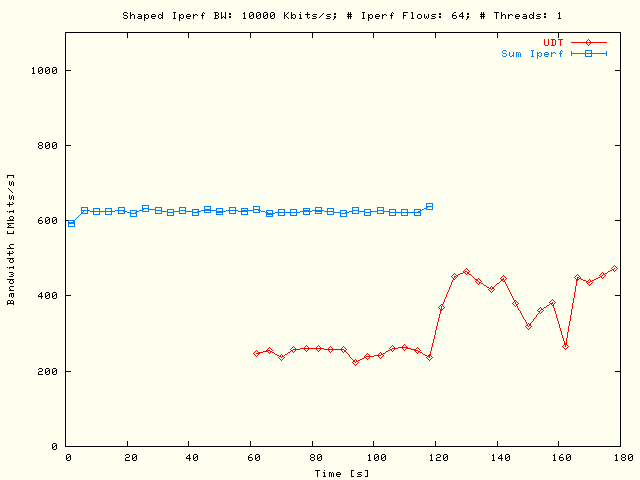
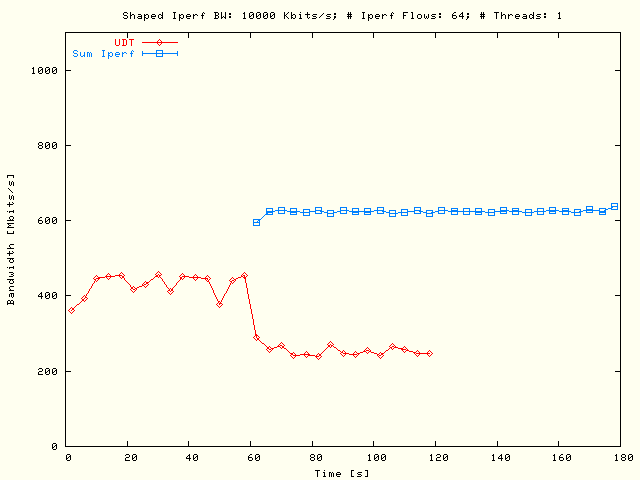
Single flow
UDT and multiple flows TCP
bandwidth as a function of the absolute test time. In the left plot the
UDT flow has been delayed and
in the right plot the TCP flows. The TCP flows were defined by all
possible 11 × 11 node pairs, using one parallel flow per
node pair. The shaped TCP bandwidth was
10 Mbits/s. |
Conclusions
From the results in
the following conclusions can be drawn:
-
With zero roundtrip time the UDT
flow is almost completely adjusting itself to the multiple
Iperf flows which are
almost not influenced by it.
-
There are no significant differences between the tests where the
UDT flow is started first and the
reverse situation where the
Iperf flows are started
first. The (almost) zero round-trip times are probably the reason for that.
-
There is almost no variation in the
Iperf bandwidth values.
Presumably that will also be connected with the zero round-trip time values.
-
As stated before: in the shaped bandwidth variation tests there is not much
difference between the
Iperf tests with a
single flow per node pair
()
compared with the tests with five parallel flows per node pair
().
-
The unrealistic high bandwidth values from the
Iperf bandwidth reports
in the largest interval is an artifact from that tool. These values were
also found in the raw
Iperf data and are
especially true for parallel flows. May be the time values listed in the
last are underestimating the end time. This would imply that some flows are
ending later. The result would be that a too high sum bandwidth will be
suggested at the end of the interval reports.